Google Analytics Benchmarking
Benchmark your web site against thousands of other web sites, understand the 3 basic vital signs of your web site statistics and how you stack up.

At TheDMA, we install Google Analytics and Webmaster tools in each website that we build.
We are not alone, as Google Analytics is the most popular analytics by a country mile, with an 81% market share! When you set these tools up, you can opt to share your website data anonymously with Google, which then aggregates the key measures and returns this information to the community.
We believe that all your digital marketing efforts and decisions should be data “driven” with strategies, actions and decisions made on the basis of data. As the Google Benchmark data is drawn from such a huge proportion of websites globally, this is really interesting and significant data you can use to benchmark the performance of your own site and even diagnose issues to address!
So, grab your website’s analytics, and see how you measure up and what you can do!
 Pages per visit
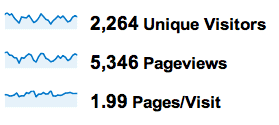
This measure is, quite as it sounds, the average number of pages seen by each visitor (calculated as total page views divided by visitors). The Google Benchmark measure is 4.5. Country by country breakdown across the OECD there is not much variation with the US at 4.7, UK at 4.9, France at 4.4. When considering your site:
- If your site is averaging 4 to 5, you’re right on average and doing well.
- More than 5 and you have an engaging site with good content.
- Less than 4, and you may have issues with your content or site navigation (as people can’t find the next pages that they are interested in).
Bounce Rate
The Bounce Rate is the percentage of visitors that view only one page of your site and then leave. They have not found what they were looking for, and have left immediately – usually within 5-10 seconds! The Google Benchmark is 48.2%. Bounce rate can be the symptom of a number of website issues, including:
- Poor meta data on the page – especially the meta description and meta title which are what appears in the search results. If these are missing, poorly written, or do not reflect the page content – the visitor will often make a hasty exit.
- Poor design, such as too many ads, confusing layout of text, too much text on the page, text and hyperlinks all mixed together, or unclear navigation – any of these will cause a visitor to leave quickly.
- A pay-per-click advertising campaign where the keywords or the ad copy to not accurately reflect the page content will also increase your Bounce Rate.
 Average Time on Site
Average Time on Site is just what is says – the average amount of time that a visitors stays on your site. The Google Benchmark is 5:23. Yes, 5 minutes and 23 seconds. Not a lot of time really, but enough for people to have a good look around, read 4 or 5 pages, and complete your enquiry form, purchase a product, or find your phone number and ring you!
In the hundreds of sites we have monitored over the years, this measure has the most variation. Sites with a more narrow focus, or a closely defined niche in the market, will often have much lower Average Time on Sites. Content rich, news sites, sites with video, audio, podcasts and rich media will often have much greater Average Time on Site.
Just as important as your Average Time on Site, also look closely at the conversions, goals and activities your site is generating – as this will tell you if the Average Time is Productive Time. If your conversions are lower than you would like, then you need to look at your content, navigation, and layout to see what can be improved. No matter how high your Average Time on Site is! Often addressing Bounce Rate issues will also improve Time on Site.

 Not Measuring Up ?
While these three Google Analytics Benchmarks are fairly simple, they can be a powerful indicator of the health and productivity of your website. The specific measures for your site will also vary from these benchmarks depending on what industry you operate in, what your audience is, and the type of content you have on your site.
Overall, these three measures are your website’s vital signs – giving you a fantastic snap-shot into how your site is performing and how engaged your visitors are with your content.

 Get Your Vitals Right First !
Before you consider any traffic acquisition strategies – activities such as running Google AdWords campaigns, or undertaking Search Engine Optimisation activities, or doing large amounts of print or associated off-line advertising of your site – STOP – and check your website vital statistics against these benchmarks. There is no point in spending big to get lots of visitors to your site if they don’t view much of your content, leave immediately, or stay only a short period of time.
Surprisingly, one third of websites don’t use any traffic or visitor analysis tools! If you are in that 33%, or would like help interpreting your data, contact TheDMA and we’d love to help you go over your website’s vital signs!
Reader Interactions